See how to generate the average ticket report using Nex on your computer.
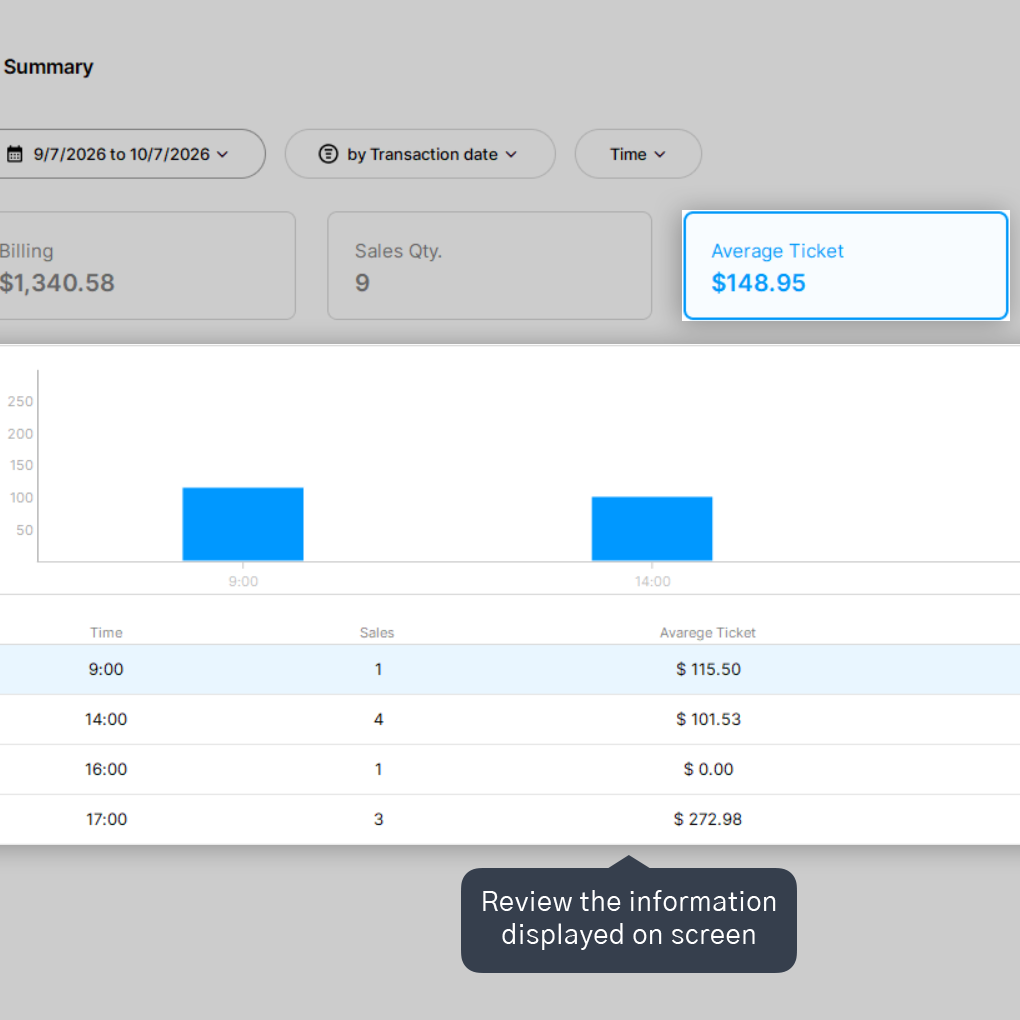
The average ticket report displays the average value of sales during your selected timeframe. The calculation performed by Nex divides total billing by the total sales quantity completed within that period (billing ÷ sales qty.).
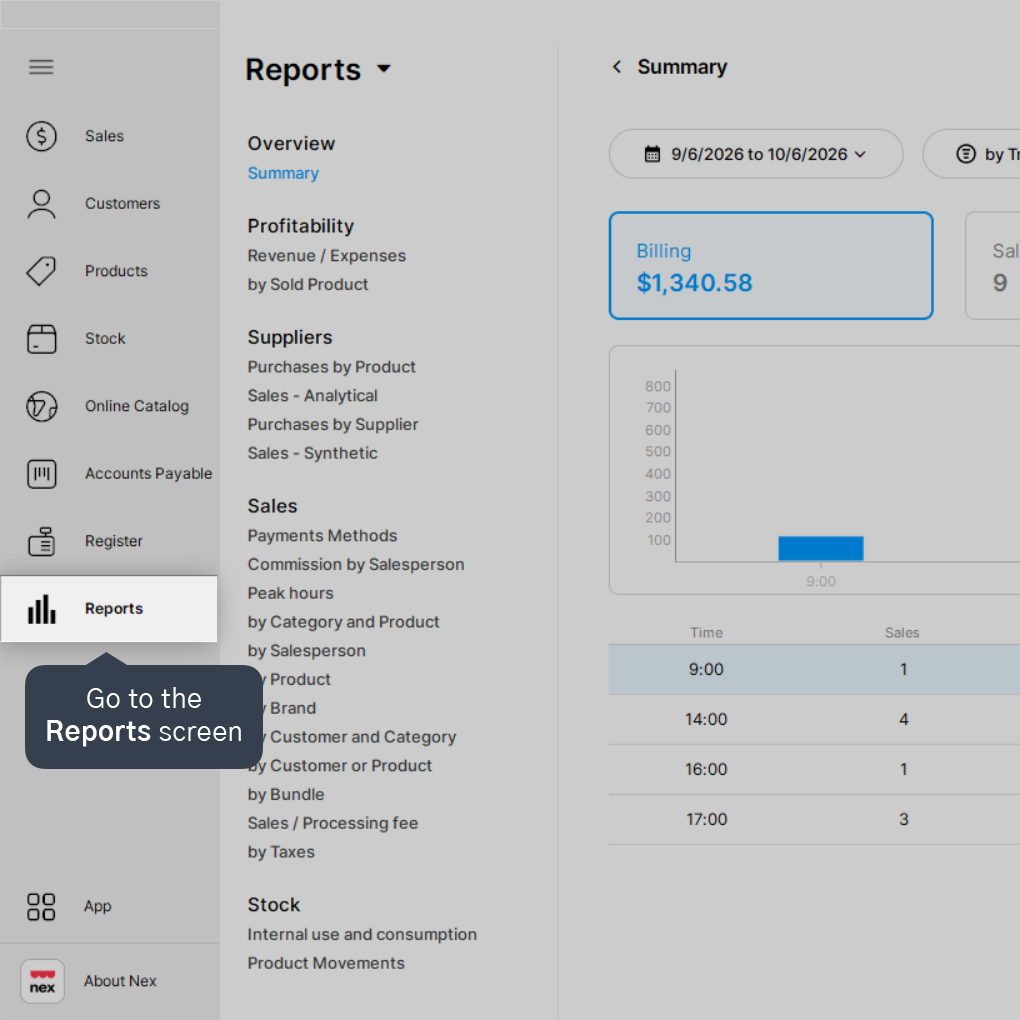
1. Go to the Reports screen.
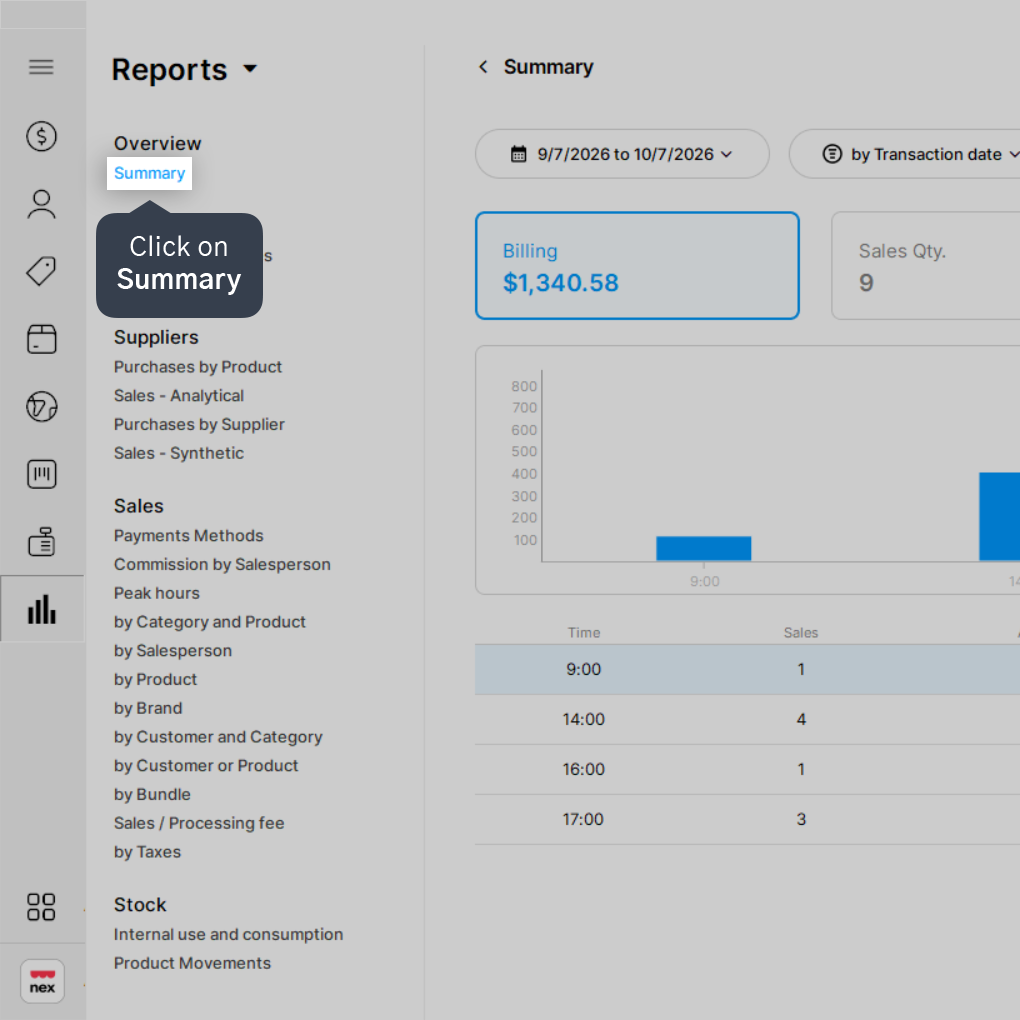
2. Click on Summary.
3. Choose the desired period to generate the report.
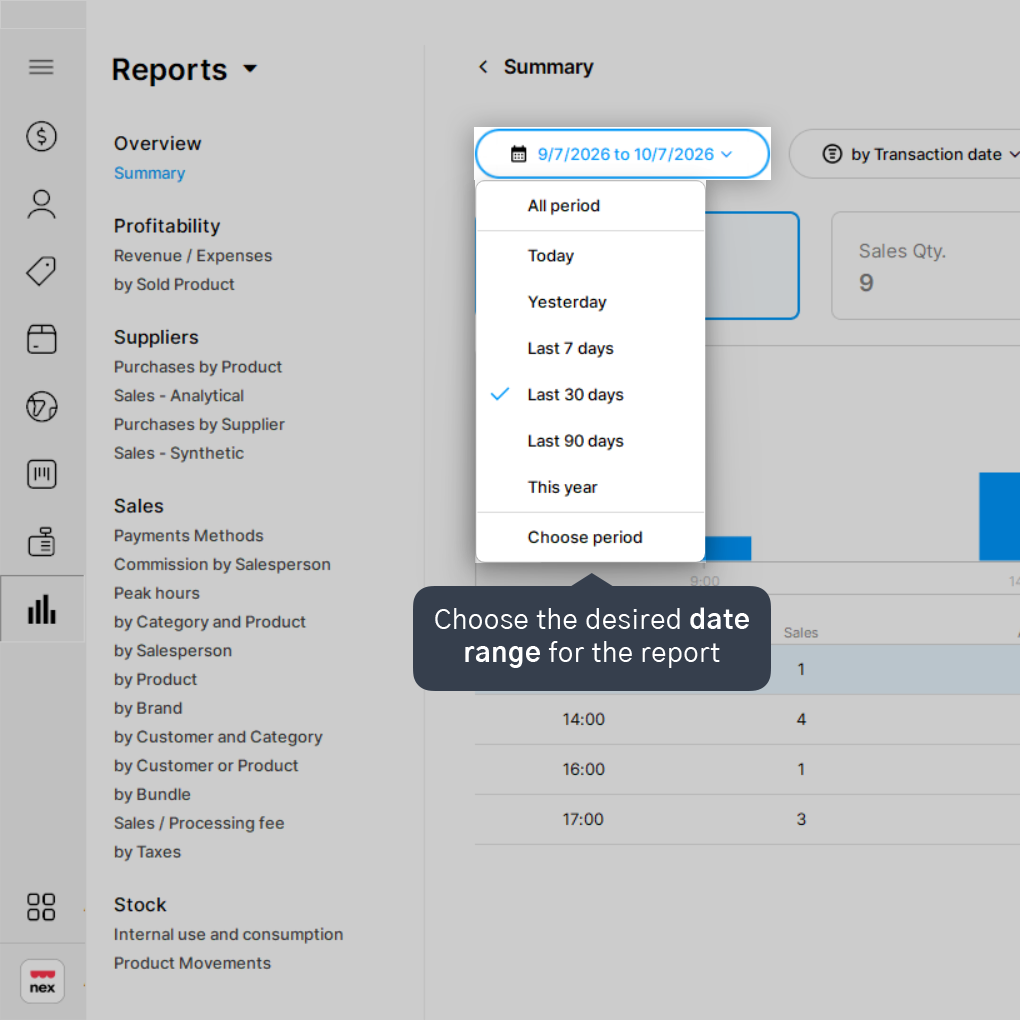
You can generate the report for Today, Yesterday, Last 7 days, Last 30 days, Last 90 days, This year, or choose a custom date range.
4. Click on Average Ticket.
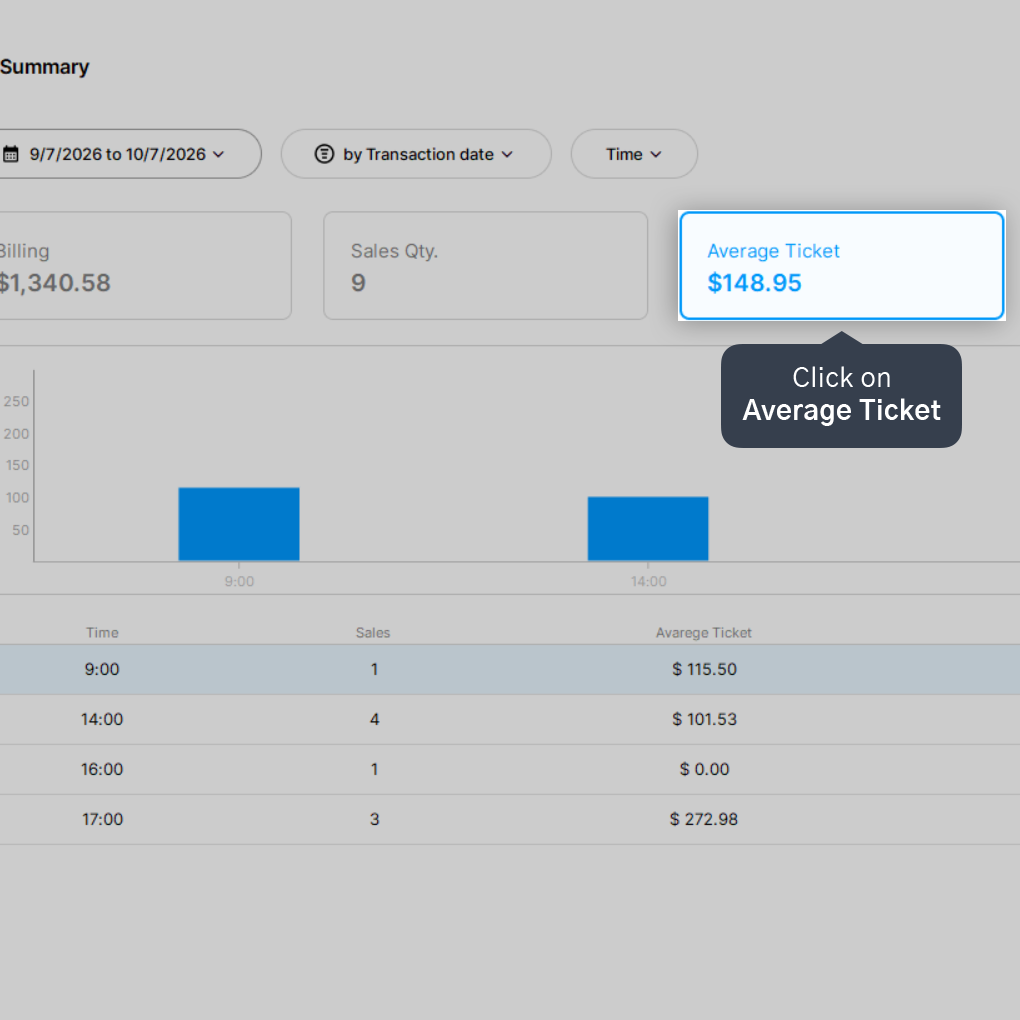
5. Review the information displayed on screen.
If you wish to export or print, click the three-dots menu icon and select your preferred option.
Done! Now you can check your average ticket metrics for any period you prefer.


